Space Invasion, Space Invaders, and Climate Change Mitigation
Jesus College, Cambridge
3rd June 2021, 6pm
Abstract
Recent advances in the field of Reinforcement Learning, a subfield of Artificial Intelligence, have shown computers can achieve superhuman performance at complex games like Go, Starcraft and the Atari Suite without human knowledge. What if, instead of playing Space Invaders, we play the game of climate change mitigation? More specifically, how can we design games where the goal is to minimise carbon emissions in some setting, and learn to play them optimally? In this talk, we’ll first establish the importance of using less energy and material to limit planet-cooking, then we’ll take the first steps toward formulating a game whose solution could help to mitigate climate change.
Code
![]()
Slides
0. Outline
1. Space Invasion: the footprint of climate chang e mitigation
2. Space Invaders: learning to control complex systems optimally
3. An Emission-minimisation Game
1. Space Invasion
Climate change mitigation is fundamentally an energy problem; society requires energy of all forms to function, and this energy still comes largely from sources that emit greenhouse gases that cause global warming. With that in mind, we can think of energy as the calories of our economies, and we can frame climate change mitigation as a diet that we must embark on. Like any diet, there are three things we can do to lose weight. Firstly, we can eat healthier meals, or get our energy from cleaner sources. We can think of this as analogous to generating energy from renewable energy resources like wind or solar. Secondly, we can eat less food, or use less energy in our lives. In our research group we call this Resource Efficiency, or maintaining the same final service for less energy input. And finally, we can keep eat the same rubbish food in similar amounts, and just exercise a few hours a day to try and burn off the calories. This is analogous to carbon capture and storage, where we continue to emit carbon dioxide by burning fossil fuels, but attach a hoover to the exhaust of the power station or industrial process and bury the gases in the same oilfield you just plucked the fossil fuels from.
So these are our climate change mitigation options. The UK has focussed largely on option 1 (renewable energy) to-date, and all of their projections rely on option 3 (carbon capture), little attention is given to motivating resource efficiency; in much the same way people prefer not to tell you to eat less when dieting. I’m going to talk initially about the problems associated with the UK’s plans, and how my research looks to address it.
High Carb(on) Diet
Low Carb(on) Diet

To do that, I need to introduce you to our unit of measurement for this diet. Instead of using the calorie, we’ll use the kilowatt-hour (kWh), the SI unit for measuring energy. To give you a sense of scale, here’s our current energy diet, and the number of kWhs associated with some everyday activities.
Leaving one 40W lightbulb on for 24 hours will use about 1kWh of energy. An aluminium can of coke requires about 0.6kWh of energy to be produced. A hot bath will cost you 5kWh. And burning 1 litre of petrol in your car by driving 5 or 6 miles will use 10kWh of energy. If we sum all activities you do daily, we find that the average person in the UK uses about 125kWh/day. Instead of quantifying energy use on a daily basis, we can convert this volume of energy to a flow rate of energy that we call power, measured in watts rather than watt-hours. So 125kWh/day of energy is equivalent to a 5kW power source consuming power for the whole day, similar to two cookers being left on at 200 degrees all day.
So this is your life, two cookers on all the time, one for the left hemisphere of your brain and one for the right. So to continue to live your life as you do today, you need to go out in the world and find a 5kW power source and have it on all day, offsetting the energy you are using elsewhere in your life. So let’s think about doing that; if you’re going to go out and find a source of power, your going to need a piece of land to put in on. How much land would you like? Well let’s give everyone in the country a fair share of land.
Our Energy Diet
💡 → 1kWh
🥤 → 0.6kWh
🛁 → 5kWh
🚗 → 10kWh
💁♀️ → 125kWh/day or 5kW → 🎛🎛
after MacKay (2008)
The population of the UK is 66.65 million apparently, and the total area of land in the UK is 242,495 square kilometres. If we divide the top one by the bottom one, we find that each person in the UK gets about 3600 square metres of space to store their energy generating devices, which is about equivalent to half a football pitch. We can do one more calculation to find the power density of your life: by taking the power rating of your life (5kW) and dividing it by your allotment size (3600m2) we find that your life costs 2.5 W/m2.
Now, this is a useful figure to obtain, because each of those energy generating devices you’re about to go and source are also quantified in this way, so we see how likely it is for each of the technologies to power your life.
Your Allotment for Energy Generation
- UK population: 66.65 million
- UK land area: 242,495 km²
- Your allotment: 3600m² ~ half a football pitch
- Your life: ~2.5 W/m$^2$

after MacKay (2008)
Here’s a table of the most common energy generating technologies. The middle column is their power density, or power output per unit land area, and the final column is an indication of whether they are zero-emission or otherwise. (The pinnochio face is reserved for technologies that are often said to be renewable, but are, in fact, not). So, remember your life requires 2.5 W/m2, what the first entry in the table is telling us is that to power your life using solely wind power we need to cover your entire allotment (and everyone else’s allotment) in wind turbines. If we wanted to use solar power, we’d need to cover about half of your football pitch in solar panels. If we wanted to use nuclear power, we would only need to use about 1% of your football pitch. And so on. So let’s try and visualise some of these interventions.
Space Requirements of Energy Generating Devices
Your life: ~2.5 W/m$^2$
| Technology | ~ Power Per Unit Land Area | Zero Operational Emissions |
|---|---|---|
| Wind | 2.7 W/m$^2$ | 💚 |
| Biomass | 1 W/m$^2$ | 🤥 |
| Solar | 6 W/m$^2$ | 💚 |
| Hydropower | 0.9 W/m$^2$ | 🤥 |
| Geothermal | 3 W/m$^2$ | 💚 |
| Natural Gas | 1300 W/m$^2$ | ⛔️ |
| Coal | 125 W/m$^2$ | ⛔️ |
| Oil | 180 W/m$^2$ | ⛔️ |
| Nuclear | 300 W/m$^2$ | 💚 |
Data: van Zalk & Behrens (2018)
Here’s your football pitch:

If you want to reserve some space for living your life, rather than just producing energy, you’ll want to cordan that off. Here’s is 40% of your land blocked off, which represents the area of UK land currently used for cities and for countryside Bossard & Otahel (2000).
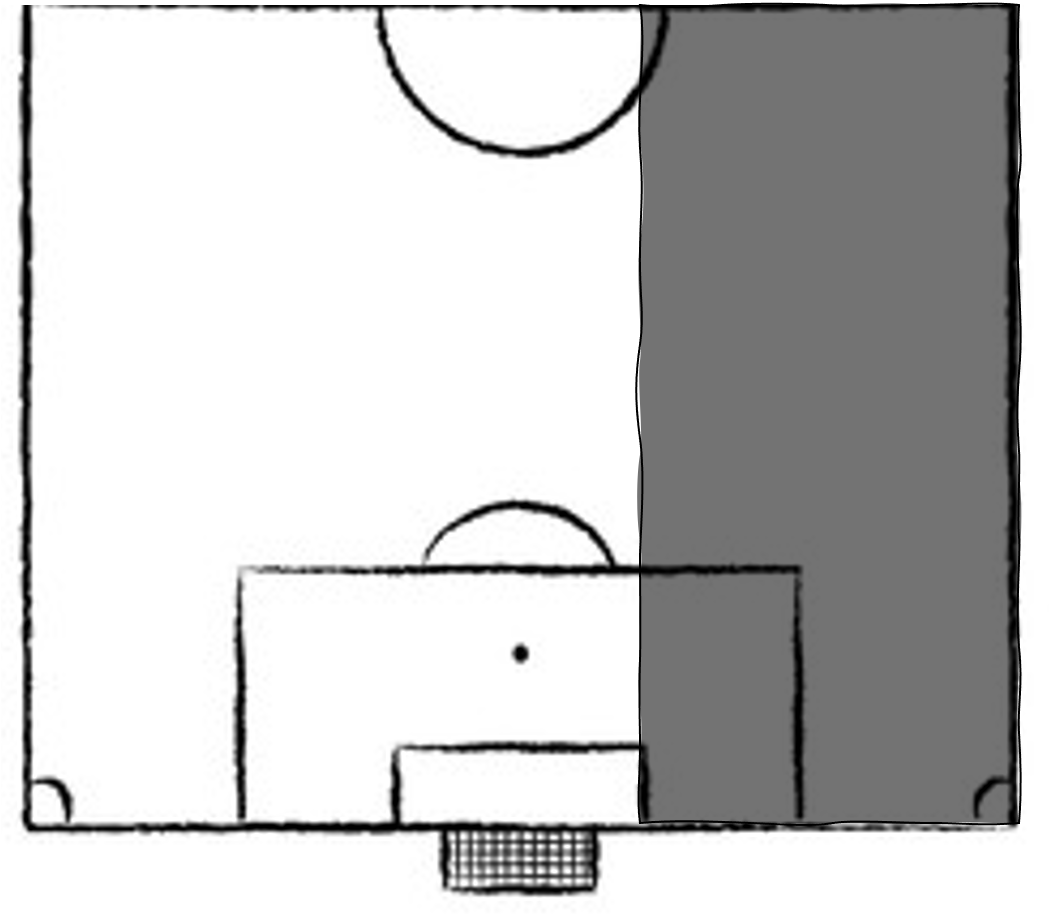
But we’ll find later on that we might need some of that land to avoid turning the UK into a desert, so it’s back on the table for now:
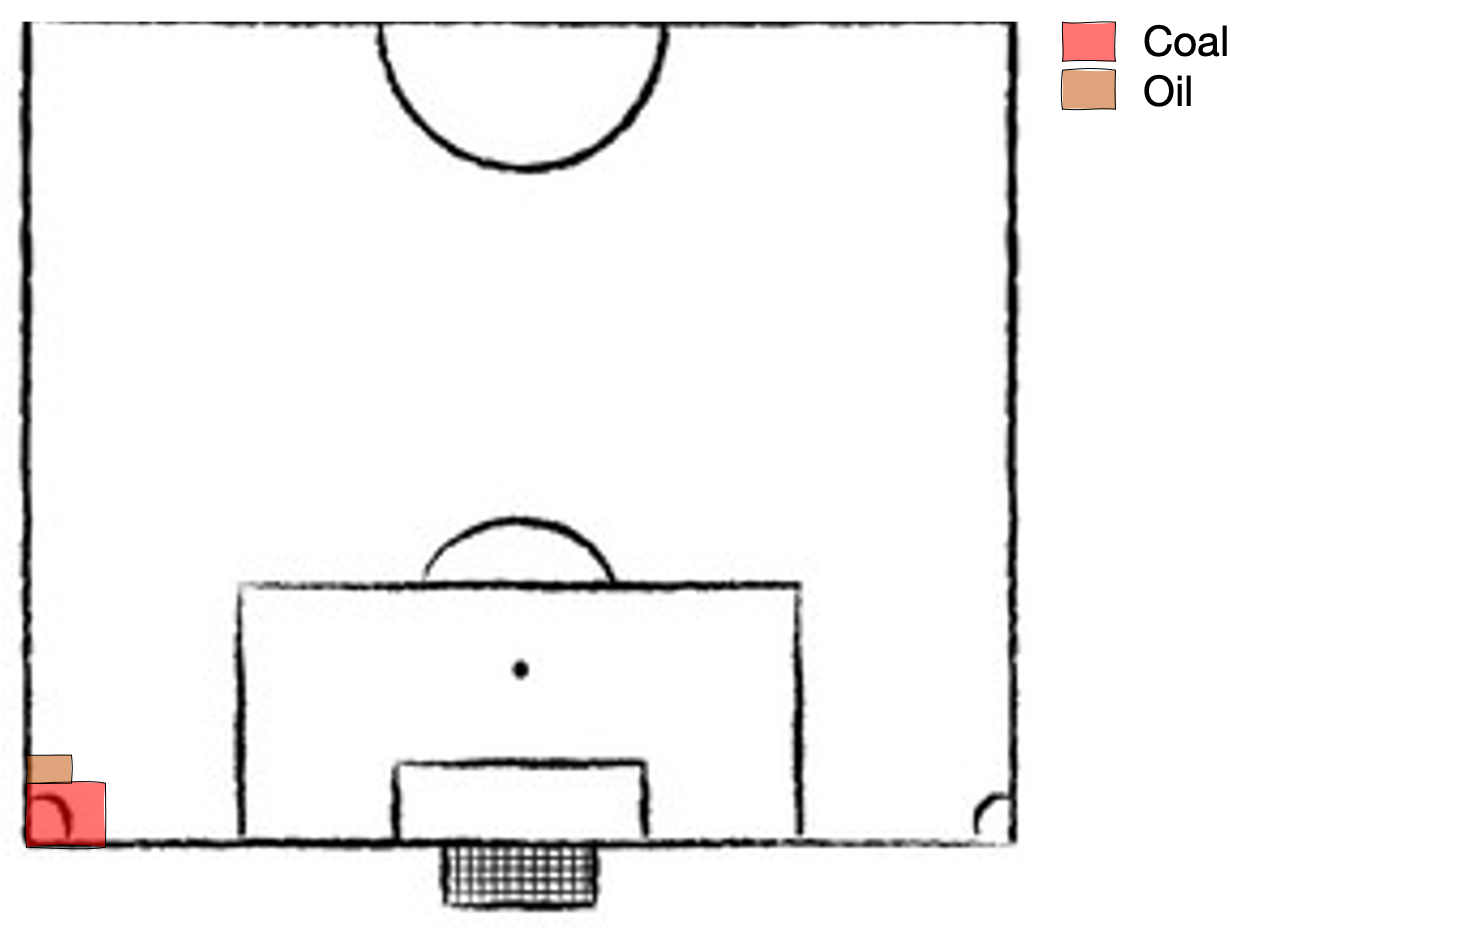
Let’s take a look at how this land has been used through the years. This was (very) roughly the UK between the beginning of the industrial revolution and the 1980s. Most electricity coming from coal, and oil used for transportation and some heating.
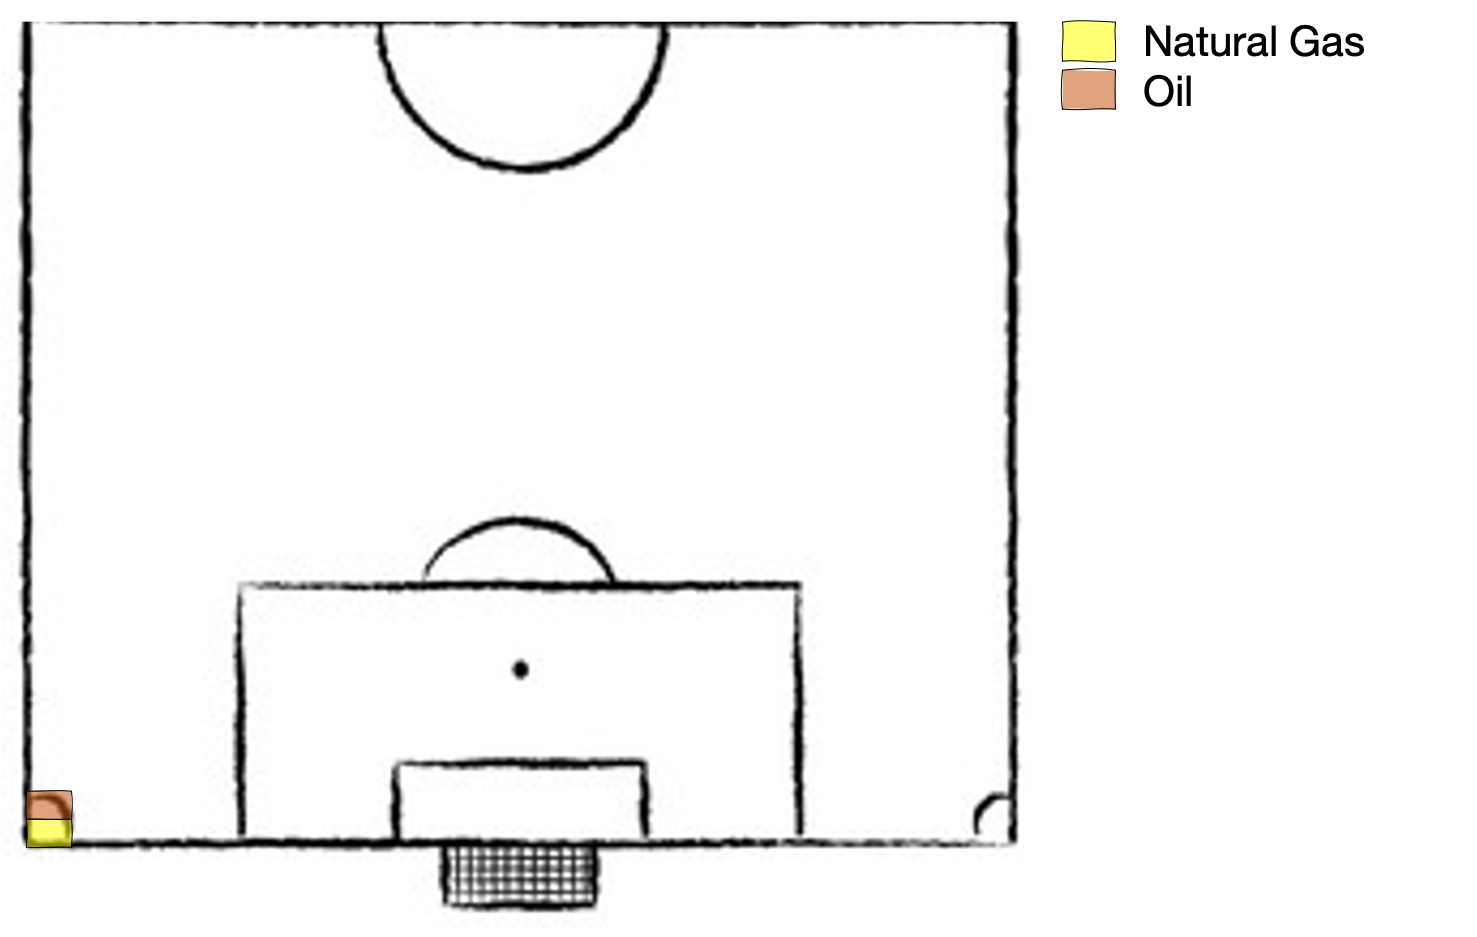
Then Mrs Thatcher came to power in the 1980s, closed most of the coal mines and replaced them with natural gas power plants of higher power density and lower emission intensity, and the energy mix looked something like this. Note: energy generation is using approximately 1% of land area here, plenty of room to continue live out the glorious 80s whilst the planet slowly begins to simmer.
Here’s (very) roughly where we are today, we have a mix of natural gas, biomass, wind, solar and nuclear; with the area of land they cover flattered by the fact that 40% of our energy is sourced from natural gas. The important takeaway from this diagram is the arbitrarily sized chequered box representing imported energy. Much of the goods and services that contribute to your 125kWh per day energy usage are imported; the aluminium in your coke can, the steel in your car. To fund our lifestyles in the UK, we are effectively outsourcing a large amount of energy production (and associated emissions), moving the energy generating devices from our land to somebody else’s land. This may be okay today, when the energy generating devices elsewhere are natural gas or coal and don’t take up much land. But when these countries attempt to decarbonise and find they are being asked or required to build solar panels on their countryside, I suspect they are going to come back to the UK and say ‘wait a minute, you deal with these emissions, you’re causing them’. This gives us a false sense of how much land the energy required to fuel our lifestyles is taking up.
So, to me, it seems only fair that we consider scenarios where we generate an amount of energy proportional to our lifestyles. And that is what we will consider now.

If we were to generate energy using only wind and solar, we would use approximately 70% of UK land area, remember cities and countryside account for 40% of land area so we are eating into our leisure area now.

There are various ways to stop this space invasion, and one of them is to shrink the size of the energy pie; to use less energy in our society; to be more resource efficient. That is the focus of our research group’s work, and that is one of the goals of my research. So, if we want to reduce our energy demand, what are our options, and where should our prioritises lie.
Reducing energy demand: what are our options?
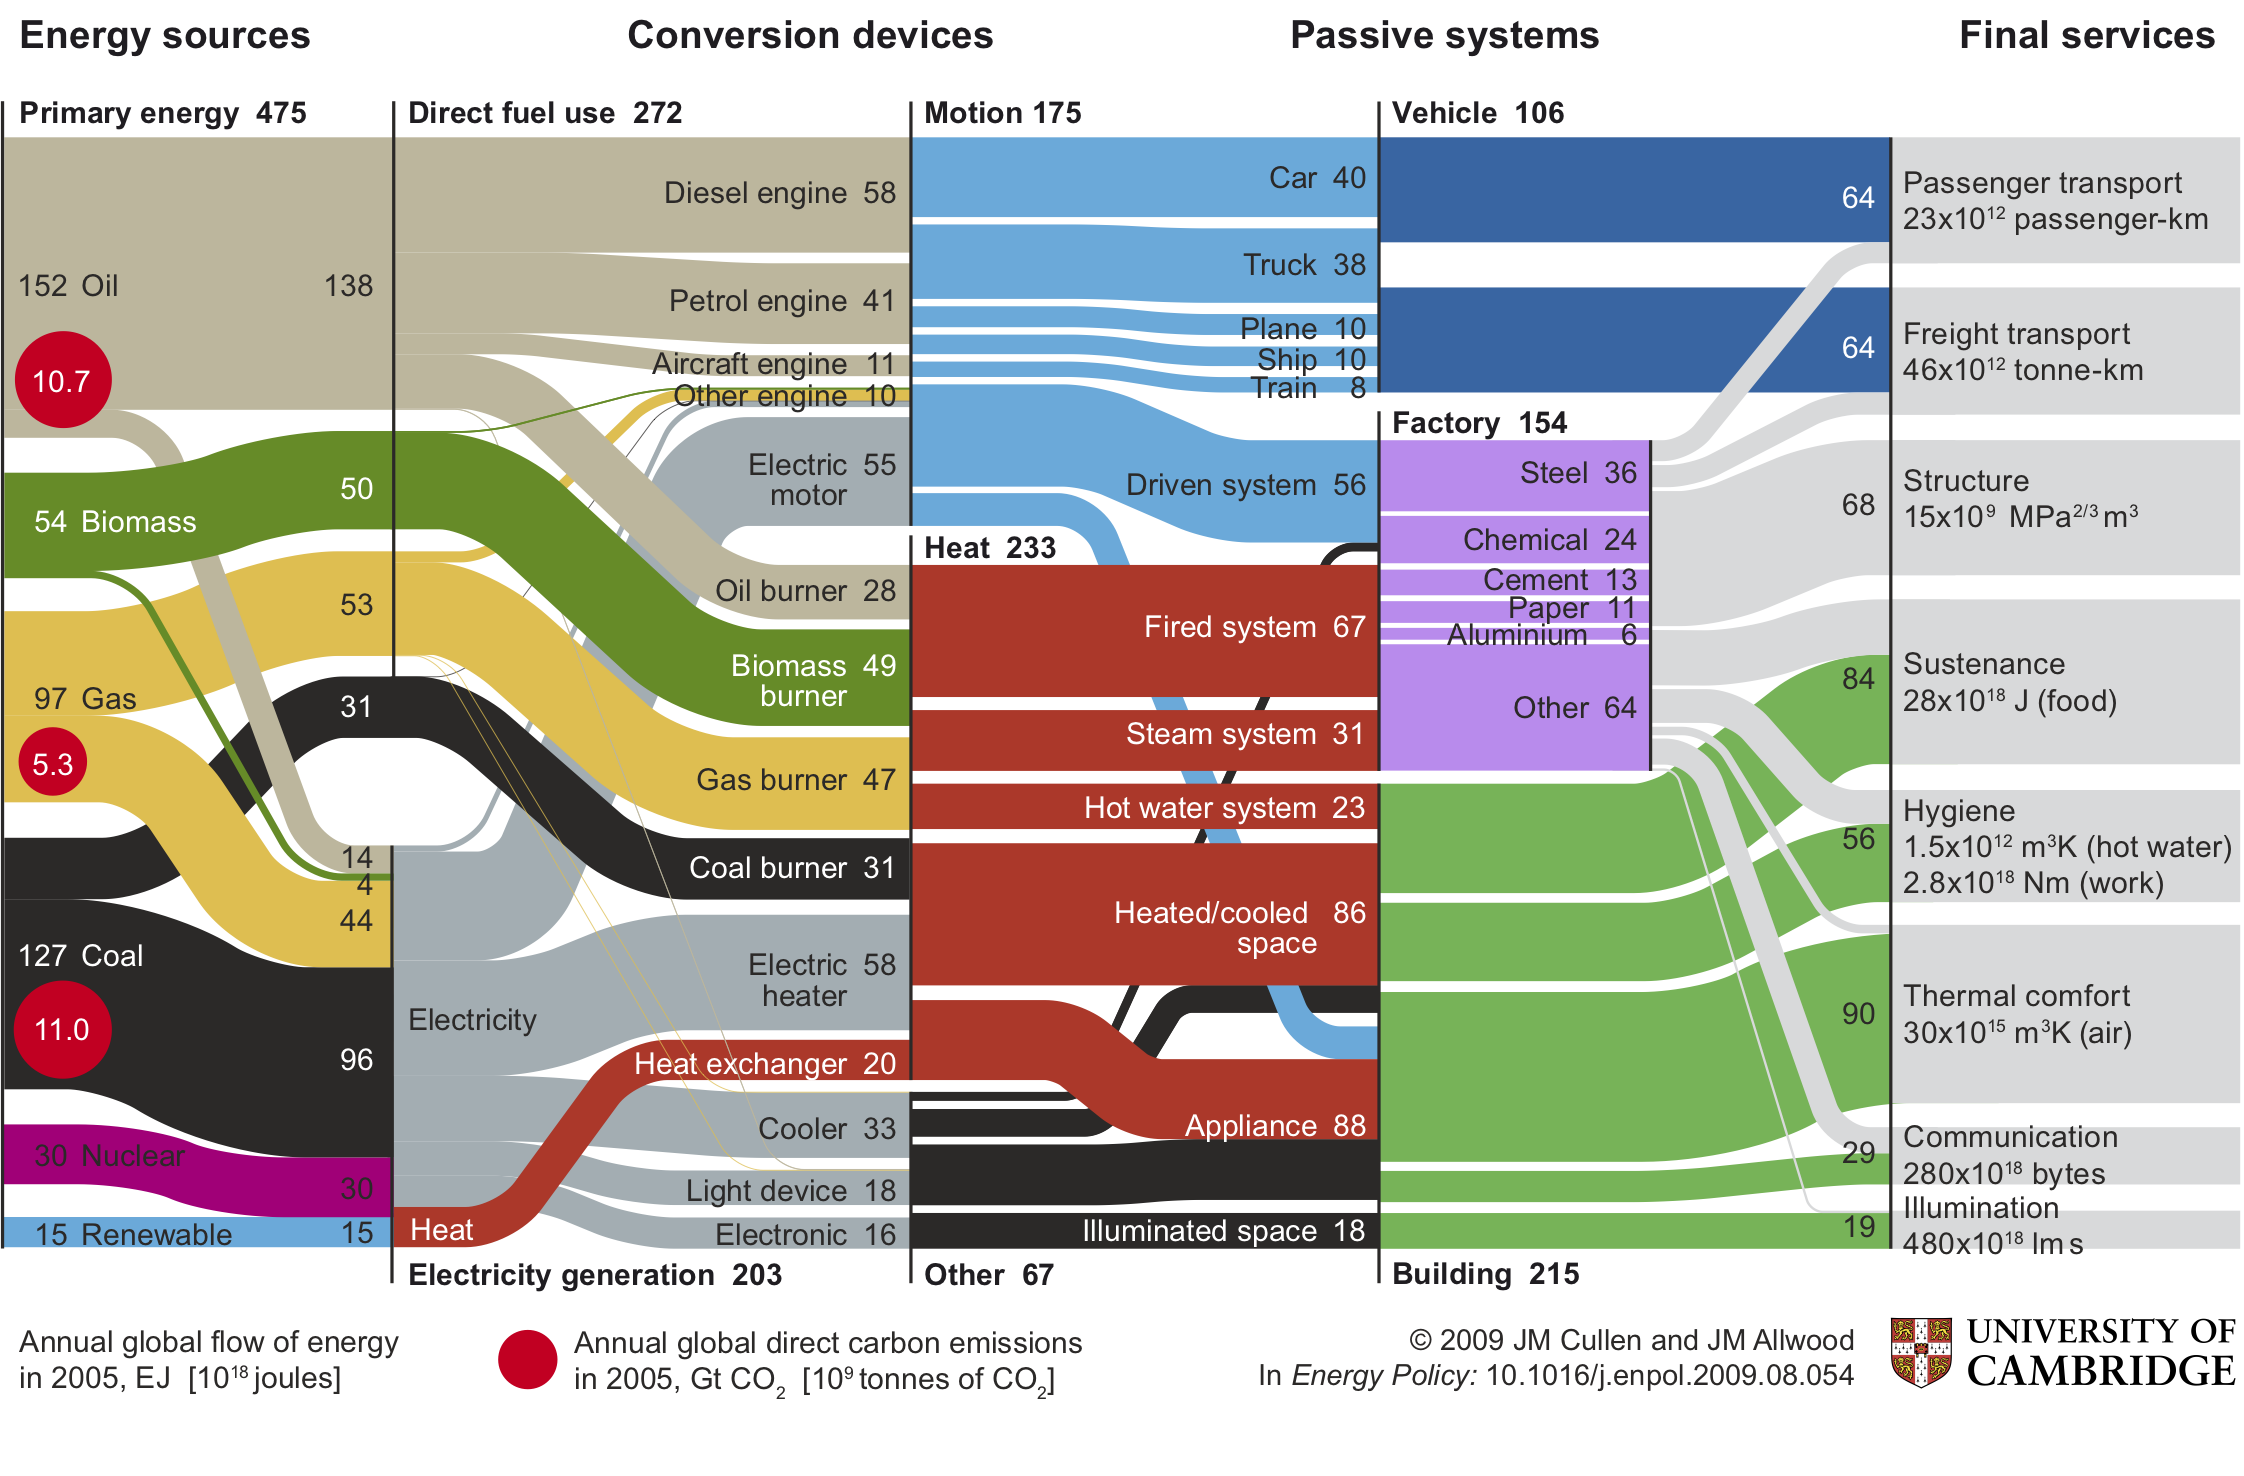
Cullen & Allwood (2010)
Above is work done by my supervisor, Jon Cullen, in 2010, mapping the relationship between energy sources and final services, via the devices that produce this transformation. I’d like to first focus your attention on the middle slice of the five illustrated. You’ll see that approximately half of global energy supply is used to produce or extract heat (red); the most obvious example of this being in the heating and cooling of homes, other examples include powering furnaces in manufacturing facilities, or in heating water. Just over a third of our energy is used to produce motion (cyan), be it powering cars, trucks or planes, or in moving heavy machinery in manufacturing. And just over 15% of energy remains for what Jon describes as ‘Other’ (black) which involves lighting, communication, and myriad of less energy-intensive services.
My research looks to affect a few parts of this diagram:
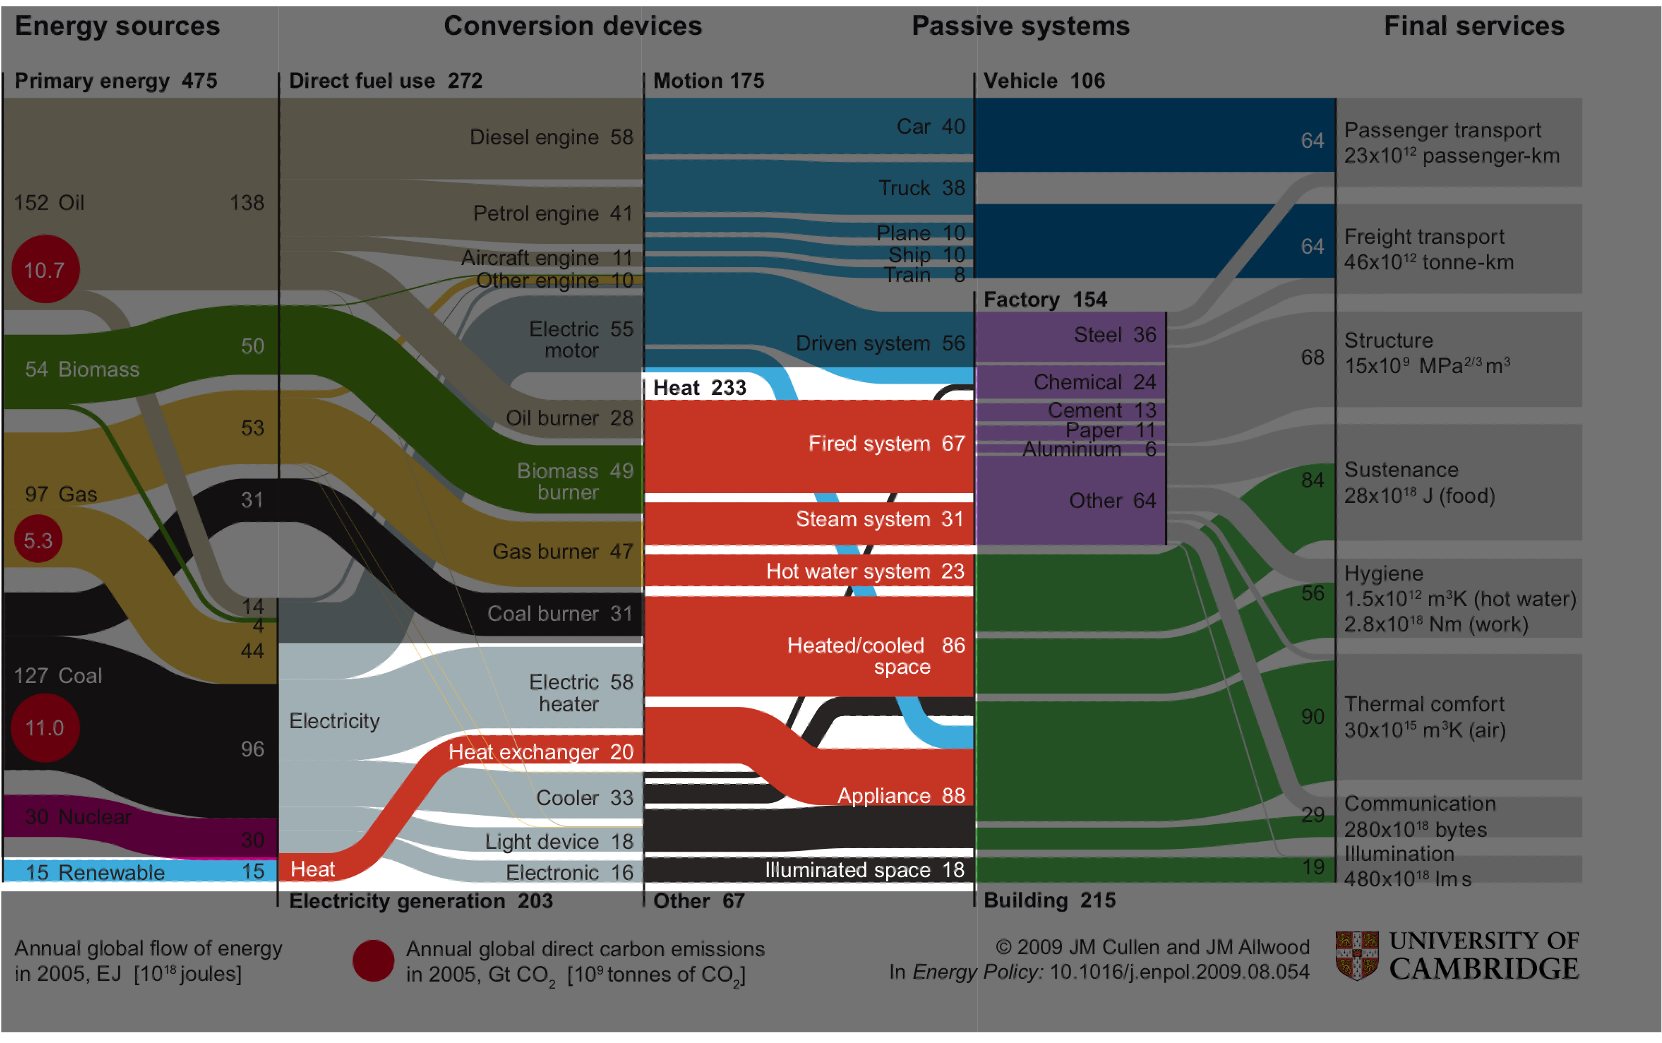
I’m interested in how the small cyan line in the bottom left hand corner: renewable energy, integrates with the energy conversion devices, and final services. Although small on this diagram, this was the global energy mix in 2005, by 2050 we expect renewable energy to supply approximately 70% of world energy. Unlike fossil fuel power stations, we cannot control when renewable energy resources will produce electricity because their ability to do so is weather dependent. For example, solar panels will produce energy during the daytime when the sun has risen, but not at night when the sun has set. We therefore say renewable energy technologies are intermittent. I’ll explain the intermittency problem visually:
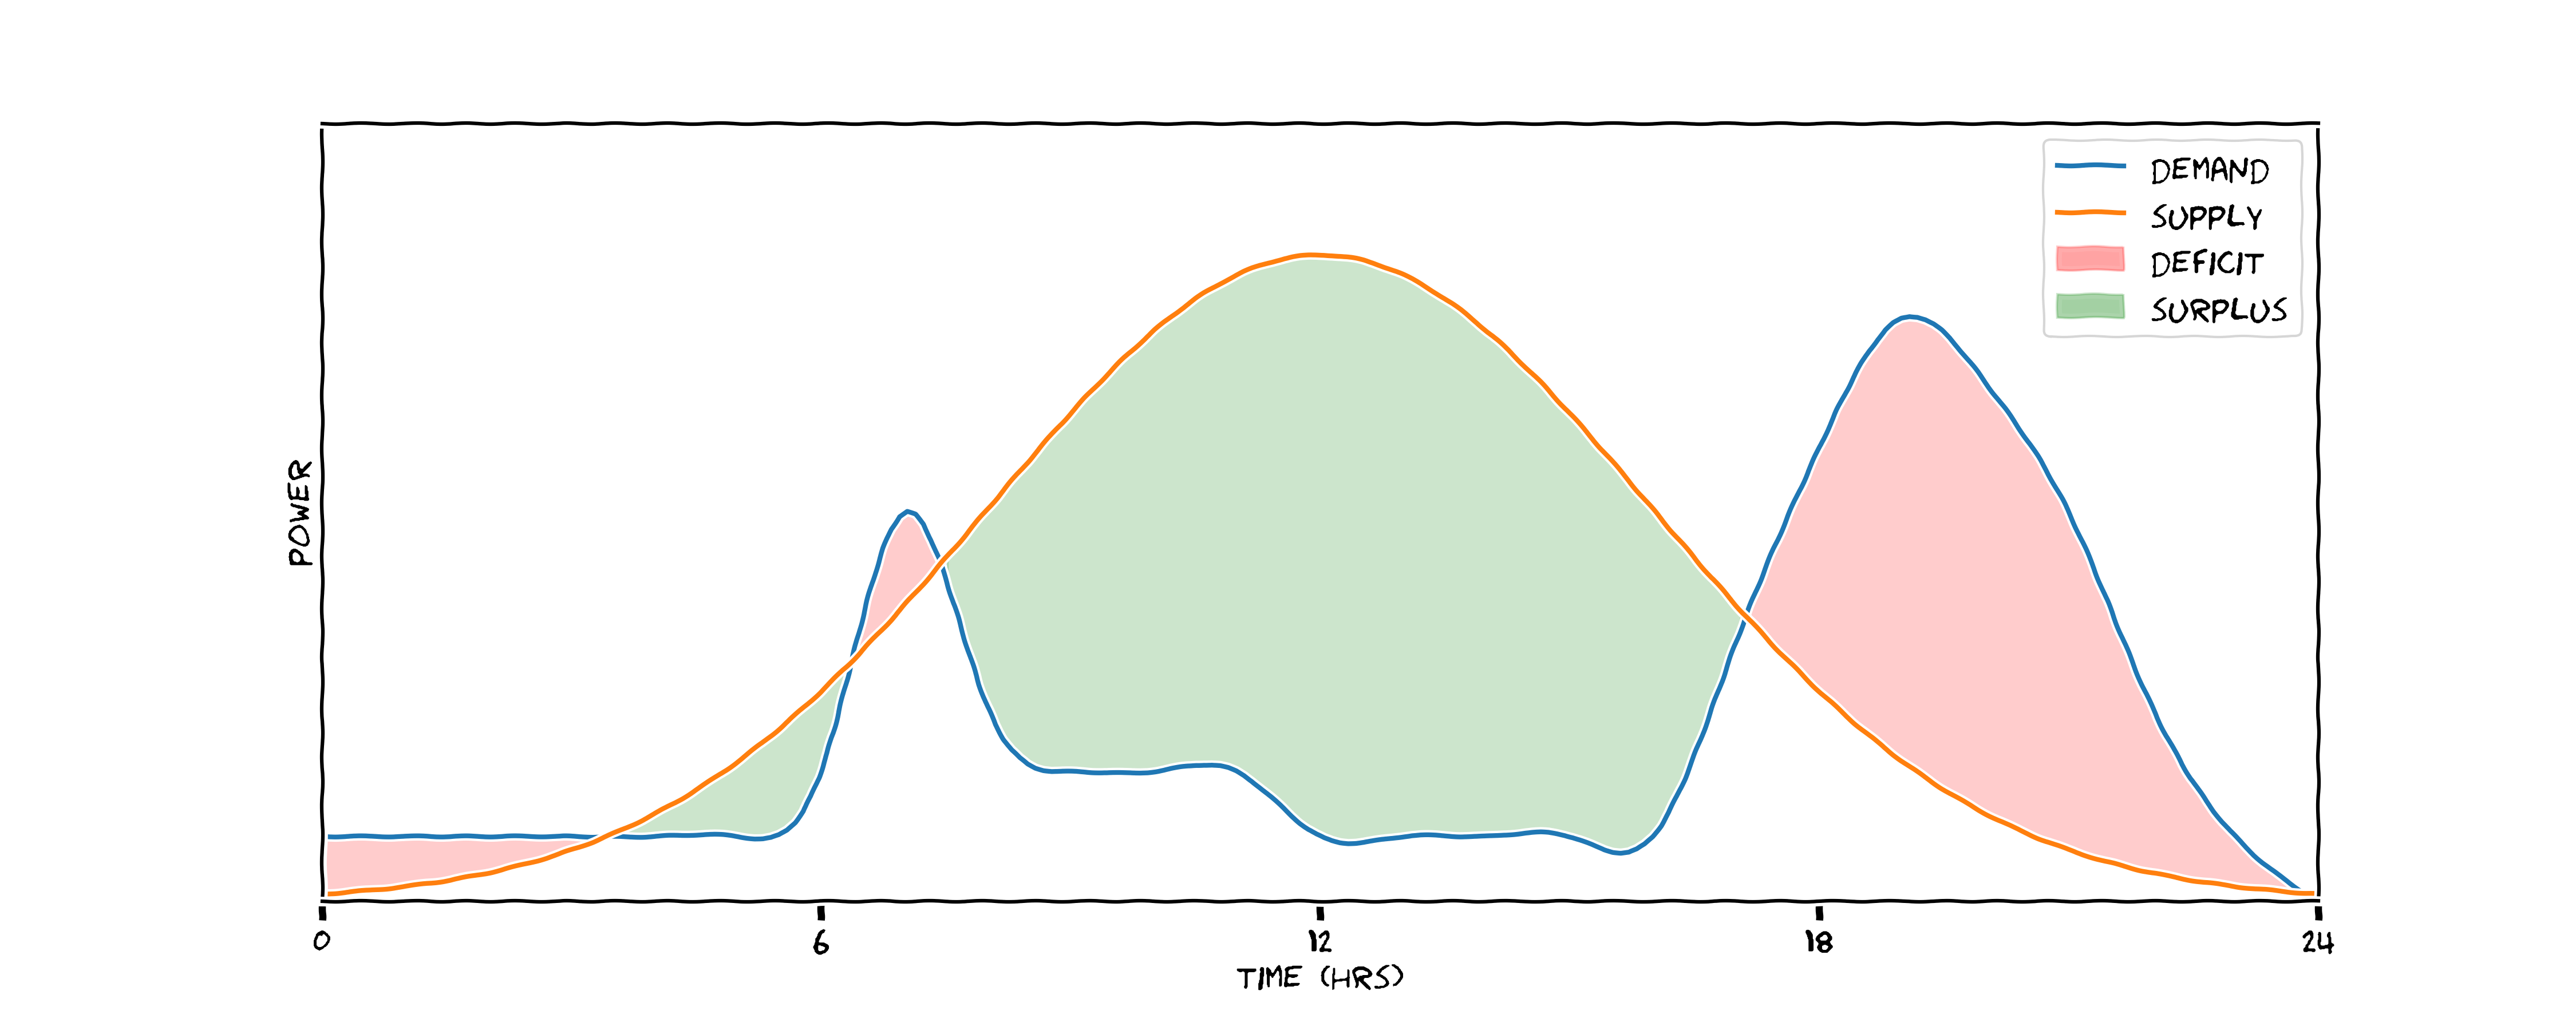
Let’s consider the problem of trying to power a flat on Park Street for one day using a 10kW array of solar panels on the roof. The orange line here traces power output of the panels throughout the day, when the sun rises in the morning it begins to produce energy, it’s power output peaks at some point in the early afternoon and then drops to 0 after the sun has set. In contrast the energy demand of the flat occupants is lumpy, there’s a peak around 7am when people get in the shower and put the kettle on for a coffee; if they go out to work for the day the power demand drops in the morning and afternoon, then when they come home and putting the heating, oven and tv in there’s another spike.
The Intermittency Problem
This creates scenarios throughout the day where there are deficits and surplusses in energy. In green, energy generation exceeds demand, so we meet our energy requirements renewably, but in the absence of a battery waste chunks of zero-emission energy. In red, demand outstrips what the panels supply. In these scenarios today, these peaks of excess supply are met by firing up natural gas plants at short notice to provide the energy, creating further emissions.
What we would prefer is a scenario like this one. Here we’ve done two things: we flattened and broadened the demand curve, so there are no peaks to meet with natural gas; and we’ve introduced a storage medium - potentially a battery. During the hours of peak production we store energy (represented by orange) and we discharge this energy when needed, represented in blue. Here, we’ve reduced our total energy demand by flattening the peak, and we’ve stopped the mitigated the problem of peak matching with natural gas - saving emissions in two ways.

This is of course an idealised representation of what we’d like to do at both a household and national scale, and it makes it look simpler that it is. In reality, both the the supply curve and the demand curve are stochastic, and matching them is a highly complex optimisation problem.
To do so we need to accurately predict renewable energy supply at various time horizons; in the next 5 minutes and in the next 5 hours, and everywhere in between. Equally we need to predict energy demand, which, depending on the situation can be affected by countless variables. In the household setting, the energy demand is largely affected by weather conditions (i.e. if it’s cold outside heating demand increases) and time of day (if it’s 7am somebody probably wants a shower). In the industrial setting, perhaps a car manufacturing plant, the energy demand of the plant may be affected by sales forecasts, and raw material delivery schedules.
Attempting to solve this problem requires some sophisticated techniques, and my research centres on a subfield of artificial intelligence called Reinforcement Learning (RL). Which I’ll take about now, in section 2: space invaders.
Intermittency: A non-trivial optimisation problem
-
Stochastic supply:
- Weather-dependent
- Need accurate predictions of supply at varied time horizons: 5mins; 5 hours; 5 days
-
Stochastic demand:
- Depending on scenario, affected by countless variables
- Household setting: outdoor temperature; time of day; day of week
- Industrial setting: sales forecasts; raw material delivery schedules
2. Space Invaders
Reinforcement learning is the eminent paradigm for allowing computers to learn from experience. In RL, we consider an agent (represented by the brain) interacting with an environment (represented by the globe). The agent can take actions in an environment, and at each timestep step it receives feedback on how the state of the environment has changed given that action, and a reward for taking that action. The goal of the RL agent is to maximise the sum of cumulative rewards throughout its lifetime. When an RL agent is instantiated, it has no understanding of its environment or valuable actions to take in the environment, but learns by taking actions in the environment, in a trial and error fashion, observing the reward it accrues, and updating it’s understanding of the state-space. It’s hypothesised that this is much the same way we as humans learn intelligently. Consider the example of learning to ride a bike; we don’t necessarily understand the physics of bike-riding, instead we get on the bike, try to balance and cycle and see what works for us. We find, through trial and error, the optimal way to position our body to balance the bike.
Although this appears a simple paradigm, it elicits extremely powerful behaviour from computers.
Reinforcement Learning

Silver (2015)
Some of the best examples of this powerful behaviour come from the gaming domain. Here’s an RL agent, created by DeepMind in 2013, that learns to play the Atari game breakout with no prior knowledge or human input. The agent is fed minimal data; it’s fed the raw pixels of the screen as a representation of the state; it’s knows it can take three actions: move left, move right, or stay still, and it’s fed the score at the top of the screen as a reward signal.
You can see initially it struggles to hit the ball, but slowly it learns first to connect with the ball. Then by episode 600 it exhibits some pretty intelligent behaviour; it discovers that the optimally strategy is to burrow holes in the channels of the bricks and ping the ball behind the bricks.
To give you a little more intuition about what is happening under the hood of an RL agent, let’s return quickly to the breakout example.
There are various ways in which the agent can represent its understanding of the system, but one is by assigning each part of the state-space (the environment) a value, and iterating it’s formulation of that value as it receives rewards from the environment.
Here we see a plot of the agent’s value estimate for the current state of the environment over time. We see a spiky pattern in the value estimate; just before the ball hits it bricks it has learned that it will receive reward shortly and estimates high value, then the value estimate drops as it knows it would receive more reward until some time into the future.
3. An Emission-Minimising Game
So I’ve introduced RL, and discussed how agents can learn to play extremely complex games with no prior knowledge to a superhuman level. I’ve also motivated the need to reduce energy-use as a climate change mitigation technique. I’m going to conclude by combining these two sections together, and discuss formulating an emission-minimising game and how we can go about finding a solution.


The game we’re going to play is controlling the energy-intensive equipment in an industrial-sized coldstorage facility in Canada. I work with a US company called Emerson Electric who own 10,000 or so of these facilities across North America; they act as a middle-ground between food manufacturers and supermarkets, that is to say, food manufacturers delivery fresh food here, the food is held for some period of time before it is picked up and delivered to supermarkets. It’s a big facility, a few football pitches in size, and consumes a lot of energy - approximately XX amount. We want to build an RL agent that can learn to control the equipment in this facility, and smooth demand in much the same way that I described earlier on with the solar PV example.
3.1 Formulating the Game
-
Moves:
- Chiller control: $\sum_{n=1}^6 a_t^n \in \mathcal{A}$, with $\mathcal{A} = [0\text{kW}, 5\text{kW}]$
-
Goal:
-
Minimise energy-use: $\min{E_t}$, while
-
Maintain temperature: $T_t \leq 3^0C$
-
-
Environment dynamics (transition function):
- ???
- $\mathbb{P}(s_{t+1}, r_{t} | s_t, a_t)$
So let’s build the game. Each game has three aspects, the moves we can take, its goal and the environment dynamics or transition function.
Our available moves are related to the 6 chiller units in the facility, these are what use energy and regulate the temperature. We can actuate each of these 6 chillers in the continuous region between 0kW and 5kW, where 0kW is the chiller off and 5kW is the chiller at full power.
Our goal is twofold: minimise energy-use in the facility whilst maintaining the temperature below 3 degrees celcius which is the safe temperature range for the food inside.
Finally the environment dynamics or transition function - something I haven’t yet discussed. The is a mapping that represents how the state of the environment evolves given our actions from some state. In the Atari example, it’s straightforward: I move the joystick right and the paddle moves to the right; in our example it’s more complex and not obvious. How the temperature in the room changes given the agents actions is complex and non-linear. We need to learn this so that we can setup a simulator of the environment that the agent can play in and learn to control.
The details of how this is done is the topic for another talk, but in summary we use other supervised machine learning techniques to do this.
Learning the Environment Dynamics/Transition Function

Here’s a representation of the transition function, estimated using a Gaussian Process. In red, is how the temperature of the coldstorage facility varied over a few day last July given the actions of the existing controller. In green, is our transition function’s prediction of what happened in that same time period, and you can see it’s pretty accurately characterised the dynamics of the system given chiller actuation.
3.2 Playing the Game
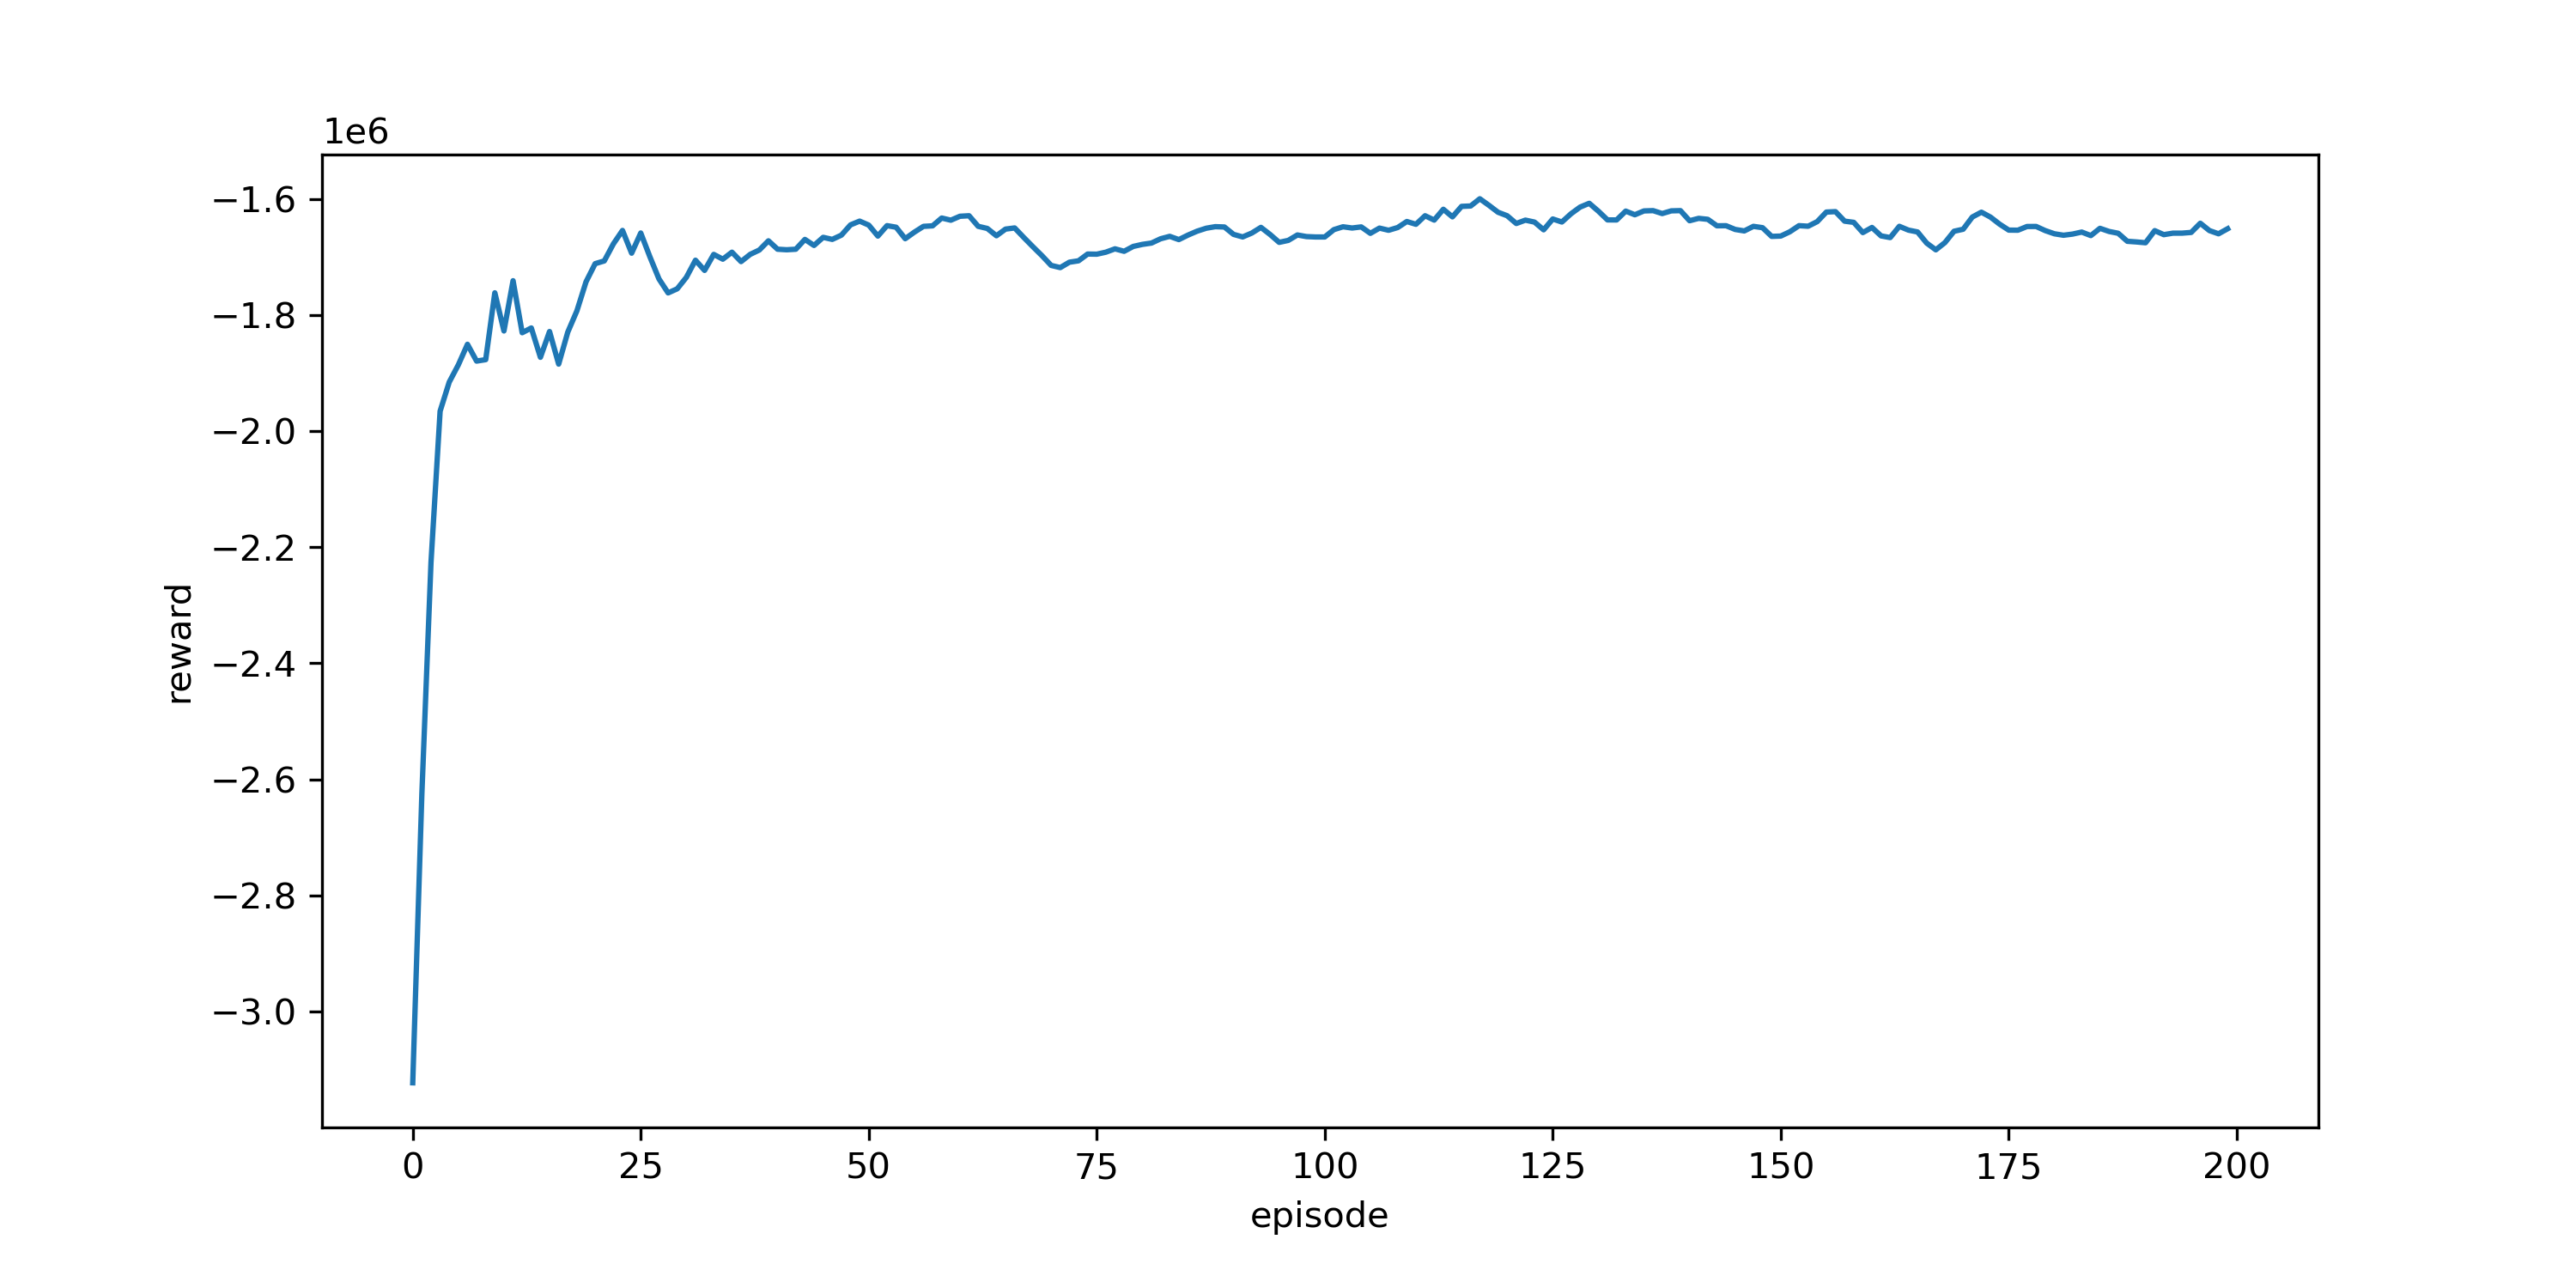
Now that we’ve set up the game let’s play. We play it for 200, one month episodes in simulation, this is the same as practicing controlling the facility for about 15 years. The y-axis here is cumulative reward per episode; you can see it starts out poorly, with no idea how to control the system, but quickly learns which actions are good ones. After about 50 episodes we’re at near-optimal behaviour.
3.3. Winning the Game

Let’s now compare our agent with the existing controller by running it through the same scenarios it was required to. Here’s one day’s plot from last September. In blue is the combined power output of the chillers, and in dashed purple is the average temperature in the facility. You can see quite stochastic behaviour, and the temperature is not regulated particularly well.

Let’s now run our RL agent in the same setting and see what happens. So the first thing to note is the green-dotted line. Our agent has learned to control the facility at just below 3 degrees Celsius and used much less power as a result. It also smooths the spiky nature of demand. I should point out, that this sort of behaviour is unlikely in the real world, because unforeseen stochasticities will inevitably push the temperature beyond 3 degrees, so we would likely set the agent to control for, say 2.7 degrees to account for this.
Limitations
- Sample inefficiency
- Robustness to out of distribution events
- No online learning
Next Steps
- Incorporate grid stochasticity
- Incorporating uncertainty
- Improve data-efficiency
- Consider multi-agent systems
I’ll end with some limitations and next steps. Firstly the limitations, you’ll note that I said this agent trained on 15 years of simulation, this is completely unrealistic for real settings. The agent may not be robust to out of distribution, unforeseen events and we need to address that. And there is no online learning, these models were trained using data from the facility, again to scale this approach to every energy-intensive building around the world we need to stick a box to the side of a building and learn with no prior knowledge.
Next steps for me and to incorporate the grid stochasticity that I discussed in the toy example; try and incorporate uncertainty into the agent’s action selection to improve robustness; use or adapt new algorithms to improve data-efficiency; and consider multi-agent systems where many agents are trying to draw power from the grid simultaneously.
Thanks!
- Website: https://enjeeneer.io
- Questions?
References
Bossard, M., Feranec, J., & Otahel, J. (2000). CORINE land cover technical guide: Addendum 2000.
Cullen, J. M., & Allwood, J. M. (2010). The efficient use of energy: Tracing the global flow of energy from fuel to service. Energy Policy, 38(1), 75-81.
MacKay, D. (2008). Sustainable Energy-without the hot air. UIT cambridge.
Mnih, V., Kavukcuoglu, K., Silver, D., Graves, A., Antonoglou, I., Wierstra, D., & Riedmiller, M. (2013). Playing atari with deep reinforcement learning. arXiv preprint arXiv:1312.5602.
Silver, D., Schrittwieser, J., Simonyan, K., Antonoglou, I., Huang, A., Guez, A., … & Hassabis, D. (2017). Mastering the game of go without human knowledge. nature, 550(7676), 354-359.
Silver, D. (2015). Lecture 1: Introduction to reinforcement learning. Google DeepMind, 1, 1-10.
van Zalk, J., & Behrens, P. (2018). The spatial extent of renewable and non-renewable power generation: A review and meta-analysis of power densities and their application in the US. Energy Policy, 123, 83-91.
6a8eb44 @ 2024-04-09